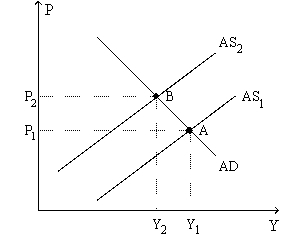
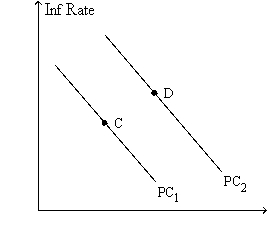
Figure 35-9. The left-hand graph shows a short-run aggregate-supply SRAS) curve and two aggregate-demand AD) curves. On the right-hand diagram, "Inf Rate" means "Inflation Rate." 

-Refer to Figure 35-9. The shift of the aggregate-supply curve from AS1 to AS2
A) results in a more favorable trade-off between inflation and unemployment.
B) results in a more favorable trade-off between inflation and the growth rate of real GDP.
C) represents an adverse shock to aggregate supply.
D) represents a favorable shock to aggregate supply.
Correct Answer:
Verified
Q7: Which of the following is correct if
Q10: When they are confronted with an adverse
Q12: Which of the following is not associated
Q16: A favorable supply shock causes the price
Q18: Figure 35-9.The left-hand graph shows a short-run
Q20: Which of the following results in higher
Q36: An adverse supply shock causes output to
A)rise.To
Q183: An adverse supply shock will shift short-run
Q269: Figure 35-9. The left-hand graph shows a
Q273: Figure 35-9. The left-hand graph shows a
Unlock this Answer For Free Now!
View this answer and more for free by performing one of the following actions

Scan the QR code to install the App and get 2 free unlocks

Unlock quizzes for free by uploading documents