The following histogram represents the distribution of acceptance rates (percent accepted) among 25 business schools in 2004. In each class interval, the left endpoint but not the right is included, so the class intervals are 10 rate < 15, 15 rate < 20, etc. 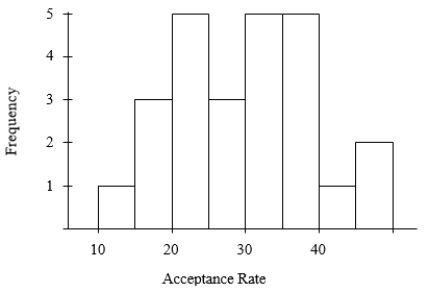 What is the median acceptance rate?
A) 20%
B) just below 30%
C) just above 30%
D) 40%
Correct Answer:
Verified
Q30: A survey of 10 students was conducted
Q31: Enteroliths are calcifications that form in the
Q32: In a class of 100 students, the
Q33: The following histogram represents the distribution
Q34: Enteroliths are calcifications that form in the
Q36: The median age of five people in
Q37: There are three children in a room,
Q38: In a class of 100 students, the
Q39: Which of the following sets of four
Q40: A survey of 10 students was conducted
Unlock this Answer For Free Now!
View this answer and more for free by performing one of the following actions

Scan the QR code to install the App and get 2 free unlocks

Unlock quizzes for free by uploading documents