A study of obesity risk in children in a head start program used a food score calculated from a 45-question food survey to predict body mass index (BMI) percentile in these children 18 months after the initial survey. The study enrolled 20 children. The researchers used a linear regression model for the prediction of BMI percentile. The food scores ranged from 45 to 245. The residual plot below was obtained by the researchers. 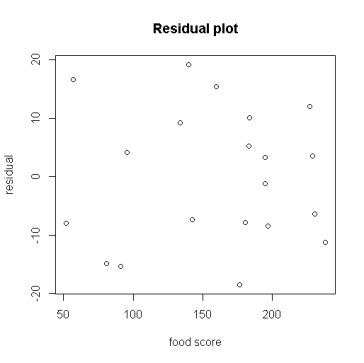 The plot does not show any obvious model violations because:
A) there is no pattern in the plot.
B) the residuals are spread evenly around the horizontal line through zero.
C) there are no obvious outliers.
D) All of the answer options are correct.
Correct Answer:
Verified
Q19: The scatterplot below suggests a linear
Q20: The scatterplot below suggests a linear
Q21: The following is a scatterplot of a
Q22: A study of obesity risk in children
Q23: A study of obesity risk in children
Q25: A study of obesity risk in children
Q26: A study of obesity risk in children
Q27: The following is a scatterplot of a
Q28: Suppose we wish to predict the
Q29: A study of obesity risk in children
Unlock this Answer For Free Now!
View this answer and more for free by performing one of the following actions

Scan the QR code to install the App and get 2 free unlocks

Unlock quizzes for free by uploading documents