Consider the following scatterplot, which depicts the tread depth (measured in mils, where 1 mil = 0.001 inch) versus the number of miles driven on the tire (measured in thousands of miles) . 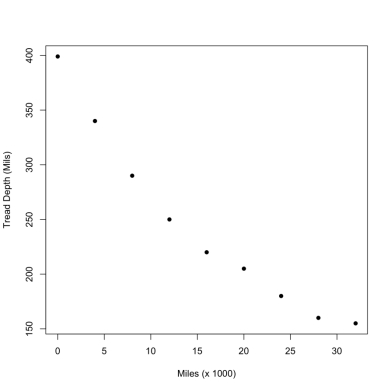 The correlation between x and y:
A) is approximately 0.97.
B) is approximately -0.97.
C) is approximately 0.
D) cannot be computed because the trend is curved.
Correct Answer:
Verified
Q24: Which of the following statements is false?
A)Older
Q25: Frequent food questionnaires (FFQ) are a simple
Q26: For each menu item at a fast
Q27: An economist conducted a study of the
Q28: An economist conducted a study of the
Q29: An economist conducted a study of the
Q31: An economist conducted a study of the
Q32: An economist conducted a study of the
Q33: An economist conducted a study of the
Q34: An economist conducted a study of the
Unlock this Answer For Free Now!
View this answer and more for free by performing one of the following actions

Scan the QR code to install the App and get 2 free unlocks

Unlock quizzes for free by uploading documents