The graph below shows a scatterplot of midterm scores plotted against homework scores. The graph contains several points that correspond to unusually low homework scores, and one of those scores is associated with the highest midterm score. 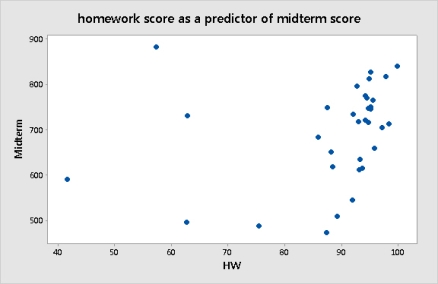 Removing this point will:
A) increase the correlation.
B) leave the correlation unchanged.
C) decrease the correlation.
D) The effect cannot be determined from the scatterplot.
Correct Answer:
Verified
Q6: A group of students participated in an
Q7: The volume of oxygen consumed (in liters
Q8: Below is a scatterplot of the number
Q9: Colleges often rely heavily on raising money
Q10: When water flows across farmland, some soil
Q12: A student wonders if people with similar
Q13: The volume of oxygen consumed (in liters
Q14: Which of the following statements is correct?
A)Changing
Q15: For each menu item at a fast
Q16: A scatterplot can be used to illustrate
Unlock this Answer For Free Now!
View this answer and more for free by performing one of the following actions

Scan the QR code to install the App and get 2 free unlocks

Unlock quizzes for free by uploading documents