From the following scatter plot,we can say that between y and x there is _______. 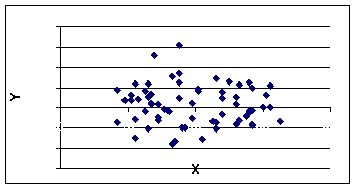
A) perfect positive correlation
B) virtually no correlation
C) positive correlation
D) negative correlation
E) perfect negative correlation
Correct Answer:
Verified
Q22: Regression output from Excel software directly shows
Q31: According to the following graphic,X and Y
Q31: Regression output from Excel software includes an
Q32: From the following scatter plot,we can say
Q34: According to the following graphic,X and Y
Q34: The range of admissible values for the
Q37: The numerical value of the coefficient of
Q41: If there is positive correlation between two
Q41: Consider the following scatter plot and regression
Q49: If there is perfect negative correlation between
Unlock this Answer For Free Now!
View this answer and more for free by performing one of the following actions

Scan the QR code to install the App and get 2 free unlocks

Unlock quizzes for free by uploading documents