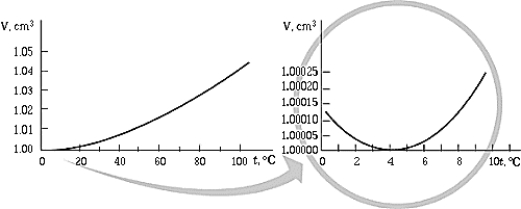
 The graph shows the volume occupied by 1 g of water as a function of temperature. The graph shows that
A) for temperatures greater than 4ºC, the volume decreases with temperature.
B) the volume of the water is a minimum at 4ºC.
C) for temperatures less than 4ºC, the volume increases as the temperature decreases.
D) for temperatures greater than 4ºC, water becomes denser as it cools.
E) All of these statements are true.
Correct Answer:
Verified
Q1: You have cut a hole in the
Q2: Mountaineers say that you cannot hardboil an
Q7: A square hole,30 cm on each
Q8: The axes on a phase diagram are
A)temperature
Q12: The coefficient of linear expansion for
Q13: A common trick to open the
Q15: Modern railway tracks consist of continuous
Q16: A sheet of metal has a star
Q16: A clock pendulum made of aluminum,which
Q20: The length of an object varies with
Unlock this Answer For Free Now!
View this answer and more for free by performing one of the following actions

Scan the QR code to install the App and get 2 free unlocks

Unlock quizzes for free by uploading documents