Multiple Choice
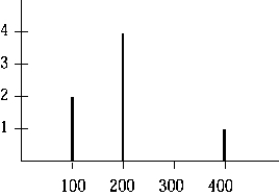 The complex wave whose frequency spectrum is shown in the figure is made up of waves whose relative amplitudes are
A) 1, 2, and 4.
B) 100, 200, and 400.
C) 1 and 4.
D) 200 and 400.
E) 1 and 2.
Correct Answer:
Verified
Related Questions
Q65: A string with mass density equal to
Q72: A piano tuner hears a beat every
Q75: A vibrating tuning fork of 850
Q77: A vibrating tuning fork is held
Q78: What is the third harmonic of an
Q80: A guitar string of length 105 cm
Unlock this Answer For Free Now!
View this answer and more for free by performing one of the following actions

Scan the QR code to install the App and get 2 free unlocks

Unlock quizzes for free by uploading documents