What type of relationship is indicated in the scatterplot? 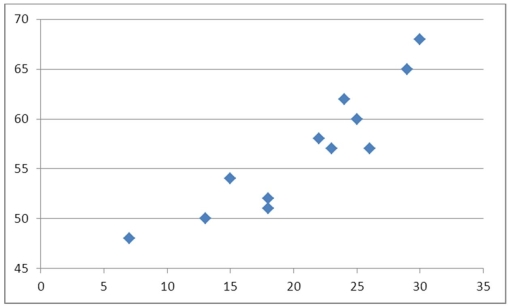
A) No relationship
B) A negative linear relationship
C) A negative curvilinear relationship
D) A positive linear or curvilinear relationship
Correct Answer:
Verified
Q56: Exhibit 2-8.Consider the following frequency distribution.
Q57: Exhibit 2-8.Consider the following frequency distribution.
Q58: The accompanying table shows students' scores from
Q59: The following histogram represents the number of
Q60: Exhibit 2-7.Thirty students at Eastside High School
Q62: Exhibit 2-14.In the accompanying stem-and-leaf diagram,the values
Q63: When displaying quantitative data,what is an ogive
Q64: Exhibit 2-14.In the accompanying stem-and-leaf diagram,the values
Q65: Exhibit 2-11.The accompanying relative frequency distribution represents
Q66: The following stem-and-leaf diagram shows the speeds
Unlock this Answer For Free Now!
View this answer and more for free by performing one of the following actions

Scan the QR code to install the App and get 2 free unlocks

Unlock quizzes for free by uploading documents