Exhibit 2-4.Students in Professor Smith's Business Statistics course have evaluated the overall effectiveness of the professor's instruction on a five-point scale,where a score of 1 indicates very poor performance and a score of 5 indicates outstanding performance.The raw scores are displayed in the accompanying table: 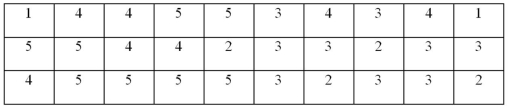 Refer to Exhibit 2-4.What percentage of students gave Professor Smith an evaluation of 2 or less?
A) 6.7%
B) 13.3%
C) 20%
D) 80%
Correct Answer:
Verified
Q27: Which of the following best describes a
Q32: The accompanying chart shows the numbers of
Q33: Exhibit 2-5.The following data represent scores on
Q34: In the following pie chart representing a
Q35: Exhibit 2-3.A city in California spent six
Q38: Exhibit 2-6.The following data represent the recent
Q39: Exhibit 2-4.Students in Professor Smith's Business Statistics
Q40: Exhibit 2-4.Students in Professor Smith's Business Statistics
Q41: Exhibit 2-7.Thirty students at Eastside High School
Q42: Exhibit 2-10.Automobiles traveling on a road with
Unlock this Answer For Free Now!
View this answer and more for free by performing one of the following actions

Scan the QR code to install the App and get 2 free unlocks

Unlock quizzes for free by uploading documents