The following data represents motor vehicle theft rates per 100,000 people for the cities of Detroit,Michigan,Newark,New Jersey,St.Louis,Missouri,Oakland,California,Atlanta,Georgia,and Fresno,California.These six cities had the highest per-capita motor vehicle theft rates in the nation in 2010. 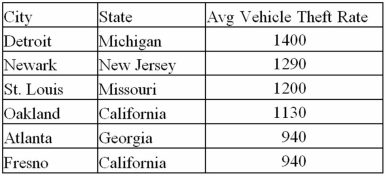 a.What is the mean and median per-capita theft rates of the above cities?
B)Given the standard deviation of the per-capita crime rate in Detroit is 200 thefts per 100,000 use the empirical rule to calculate the probability Detroit has over 1800 thefts per 100,000 next year?
Correct Answer:
Verified
View Answer
Unlock this answer now
Get Access to more Verified Answers free of charge
Q103: The following is return data for a
Q105: The following data is a list of
Q106: The following is summary measures for Google
Q109: The following table shows the annual returns
Q110: Janice Anooshian asks eight of her friends
Q111: The data shows Operating Expenses (In Millions)for
Q113: The following sample data shows the starting
Q128: The following is a list of average
Q135: The following represent the sizes of fleece
Q152: Your used car is expected to last
Unlock this Answer For Free Now!
View this answer and more for free by performing one of the following actions

Scan the QR code to install the App and get 2 free unlocks

Unlock quizzes for free by uploading documents