The following frequency distribution represents the number of hours studied per week by a sample of 50 students. 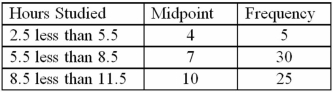 The standard deviation of the number of hours studied is:
A) 1.89
B) 2.79
C) 3.50
D) 3.56
Correct Answer:
Verified
Q84: Amounts spent by a sample of 200
Q85: The following frequency distribution represents the number
Q86: Which of the following relationships may be
Q87: Amounts spent by a sample of 50
Q88: Amounts spent by a sample of 50
Q90: Professors at a local university earn an
Q91: Professors at a local university earn an
Q92: An investor bought common stock of Blackstone
Q93: Amounts spent by a sample of 200
Q94: Professors at a local university earn an
Unlock this Answer For Free Now!
View this answer and more for free by performing one of the following actions

Scan the QR code to install the App and get 2 free unlocks

Unlock quizzes for free by uploading documents