Exhibit 12.7 The heights (in cm) for a random sample of 60 males were measured.The sample mean is 166.55,the standard deviation is 12.57,the sample kurtosis is 0.12,and the sample skewness is -0.23.The following table shows the heights subdivided into non-overlapping intervals. 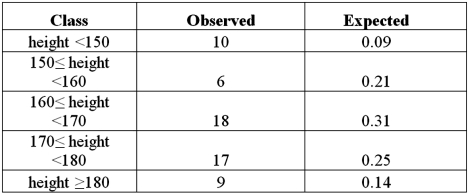 Refer to Exhibit 12.7.For the goodness-of-fit test for normality,suppose the value of the test statistic is 7.71.The p-value is:
A) Less than 0.01
B) Between 0.01 and 0.05
C) Between 0.05 and 0.10
D) Greater than 0.10
Correct Answer:
Verified
Q78: Exhibit 12.7 The heights (in cm)for a
Q79: Exhibit 12.6 The following table shows the
Q80: Exhibit 12.7 The heights (in cm)for a
Q81: A researcher wants to determine if the
Q82: Exhibit 12.8 The heights (in cm)for a
Q84: The following table shows the observed frequencies
Q85: Exhibit 12.7 The heights (in cm)for a
Q87: A researcher wants to verify his belief
Q88: Exhibit 12.8 The heights (in cm)for a
Q120: A travel agent wants to determine if
Unlock this Answer For Free Now!
View this answer and more for free by performing one of the following actions

Scan the QR code to install the App and get 2 free unlocks

Unlock quizzes for free by uploading documents