Exhibit 12.2 A university has six colleges and takes a poll to gauge student support for a tuition increase.The university wants to insure each college is represented fairly.The below table shows the observed number students that participate in the poll from each college and the actual proportion of students in each college. 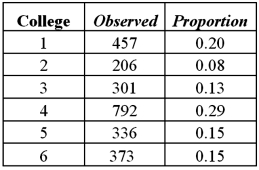 Refer to Exhibit 12.2.What is the value of the goodness-of-fit test statistic?
A) 3.08
B) 15.09
C) 15.64
D) 16.75
Correct Answer:
Verified
Q31: Exhibit 12-1 A card dealing machine deals
Q32: Suppose you want to determine if mutual
Q33: For the goodness-of-fit test for normality,the null
Q34: Exhibit 12-1 A card dealing machine deals
Q35: The calculation of the Jarque-Bera test statistic
Q37: For the Jarque-Bera test for normality,the null
Q38: Packaged candies have three different types of
Q39: For the chi-square test for normality,the expected
Q40: Exhibit 12-1 A card dealing machine deals
Q41: Exhibit 12.2 A university has six colleges
Unlock this Answer For Free Now!
View this answer and more for free by performing one of the following actions

Scan the QR code to install the App and get 2 free unlocks

Unlock quizzes for free by uploading documents