Exhibit 6-4 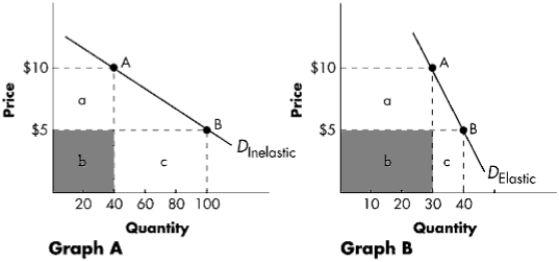
-Refer to Exhibit 6-4. Graph A represents a demand curve that is relatively ____in the range illustrated. Total revenue ____ as the price decreases from $10 to $5.
A) inelastic; decreases
B) elastic; decreases
C) elastic; increases
D) inelastic; increases
Correct Answer:
Verified
Q101: If the demand curve for a product
Q102: A jeweler cut prices in his store
Q103: Exhibit 6-4 Q104: A subsidy to wheat farmers reduces the Q105: A "war on drugs" is waged, and, Q107: The Book Nook reduces prices by 20%. Q108: If demand is unit elastic: Q109: A "war on drugs" is waged, and, Q110: If most passenger trains operate far below Q111: A jeweler cut prices in his store![]()
A)Total revenue and
Unlock this Answer For Free Now!
View this answer and more for free by performing one of the following actions

Scan the QR code to install the App and get 2 free unlocks

Unlock quizzes for free by uploading documents