Alternatives 1 and 2 in the following payoff table represent the two possible manufacturing strategies that the EKA manufacturing company can adopt.The level of demand affects the success of both strategies.The states of nature (SI) represent the levels of demand for the company products.S1,S2,and S3 characterize high,medium,and low demand,with probabilities of .3,.6,and .1,respectively.The payoff values are in thousands of dollars. 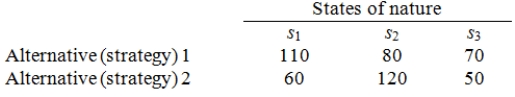 The management believes that weather conditions significantly affect the level of demand.48 monthly sales reports are randomly selected.These monthly sales reports show 15 months with high demand,28 months with medium demand,and 5 months with low demand.12 of the 15 months with high demand had favorable weather conditions.14 of the 28 months with medium demand had favorable weather conditions.Only 1 of the 5 months with low demand had favorable weather conditions.The estimated probabilities of poor weather conditions given different levels of demand are presented below.
  What is the probability of high demand given that the weather conditions are poor?
A) .06
B) .44
C) .1371
D) .12
E) .1818
Correct Answer:
Verified
Q31: Alternatives 1 and 2 in the following
Q31: A person's utility is determined by the
Q32: The expected net gain of sampling equals
Q36: Maximax is a criterion used when making
Q36: The utility curve given below represents the
Q38: The utility curve given below represents the
Q39: Alternatives 1 and 2 in the following
Q43: The _ criterion finds the worst-possible payoff
Q49: The _ criterion finds the best-possible payoff
Q52: _ statistics is an area of statistics
Unlock this Answer For Free Now!
View this answer and more for free by performing one of the following actions

Scan the QR code to install the App and get 2 free unlocks

Unlock quizzes for free by uploading documents