Alternatives 1 and 2 in the following payoff table represent the two possible manufacturing strategies that the EKA manufacturing company can adopt.The level of demand affects the success of both strategies.The states of nature (SI) represent the levels of demand for the company products.S1,S2,and S3 characterize high,medium,and low demand,with probabilities of .3,.6,and .1,respectively.The payoff values are in thousands of dollars. 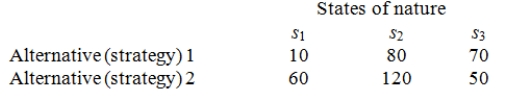 Find the expected monetary value for each of the alternatives and determine the best alternative (course of action) for the EKA manufacturing company using the expected monetary value criterion.
A) EMV1 = $98,000,EMV2 = $95,000,choose strategy 1
B) EMV1 = $88,000,EMV2 = $95,000,choose strategy 2
C) EMV1 = $88,000,EMV2 = $85,000,choose strategy 1
D) EMV1 = $66,667,EMV2 = $76,667,choose strategy 2
E) EMV1 = $120,000,EMV2 = $110,000,choose strategy 1
Correct Answer:
Verified
Q5: When making a decision in an environment
Q22: Alternatives 1 and 2 in the following
Q23: In utility analysis, a utility curve that
Q27: The _ criterion is attractive to those
Q28: The utility curve given below represents the
Q29: When we assess the worth of sample
Q30: The _ is the difference between the
Q31: A person's utility is determined by the
Q49: The _ criterion finds the best-possible payoff
Q60: The _ criterion for choosing among alternative
Unlock this Answer For Free Now!
View this answer and more for free by performing one of the following actions

Scan the QR code to install the App and get 2 free unlocks

Unlock quizzes for free by uploading documents