Short Answer
Let the function whose graph is shown be a probability density function. Calculate the mean. 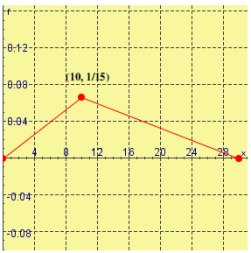
Correct Answer:
Verified
Related Questions
Q3: The manager of a fast-food restaurant
Q4: A type of lightbulb is labeled
Q5: A hot, wet summer is causing
Q6: If f (x) is the probability
Q7: Let
Q9: A demand curve is given by
Q10: A gate in an irrigation canal
Q11: You are given the shape of the
Q12: You are given the shape of the
Q13: Suppose the average waiting time for
Unlock this Answer For Free Now!
View this answer and more for free by performing one of the following actions

Scan the QR code to install the App and get 2 free unlocks

Unlock quizzes for free by uploading documents