Suppose a predator has two different prey, Species 1 and Species 2. You perform a series of experiments in which the density of Species 1 is varied while the density of Species 2 is kept constant. At each Species 1 density, you determine how many prey of Species 1 and 2 are taken by the predator. The two curves (a and b) plotted in the following graph show the outcome of this study. Based on the graph, which of the following statements is true? 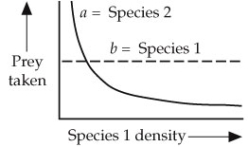
A) Curve a indicates that Species 2 is the preferred prey.
B) Curve b indicates that Species 1 is the preferred prey.
C) Curve b indicates that Species 1 is not the preferred prey.
D) Both a and c
E) Neither curve provides insight into the prey preference of the predator.
Correct Answer:
Verified
Q102: Two species of mice live in the
Q103: The few females that reproduce in eusocial
Q104: Which of the following is an example
Q105: Animals exhibit daily rhythms in their behavior
Q106: Use the following to answer questions:
Two mice,
Q108: Hygienic behavior in honey bees
A) is adaptive
Q109: Use the following to answer questions:
Refer to
Q110: Use the following to answer questions:
Refer to
Q111: Use the following to answer questions:
Two mice,
Q112: Which of the following statements about the
Unlock this Answer For Free Now!
View this answer and more for free by performing one of the following actions

Scan the QR code to install the App and get 2 free unlocks

Unlock quizzes for free by uploading documents