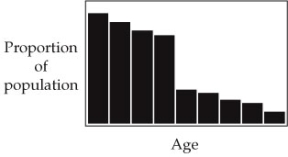
Refer to the graph of age distributions below. For a population that is stable in size, the age distribution of the graph would indicate 
A) high birth and death rates.
B) low birth and death rates.
C) a low birth rate but a high death rate.
D) a high birth rate but a low death rate.
E) Either a or d
Correct Answer:
Verified
Q99: Biologists construct _ tables to display information
Q100: A greater likelihood of parasite infestation as
Q101: In the life table below, survivorship is
Q102: Use the following to answer questions :
Refer
Q103: The best way to decrease the population
Q105: Use the following to answer questions :
Refer
Q106: How does the division of some populations
Q107: Which of the following would probably not
Q108: Use the following to answer questions :
Refer
Q109: Which of the following is an aspect
Unlock this Answer For Free Now!
View this answer and more for free by performing one of the following actions

Scan the QR code to install the App and get 2 free unlocks

Unlock quizzes for free by uploading documents