Which of the graphs below best represents the relationship between the levels of carbon dioxide and the average extent of glaciation over the last half million years of Earth's history? 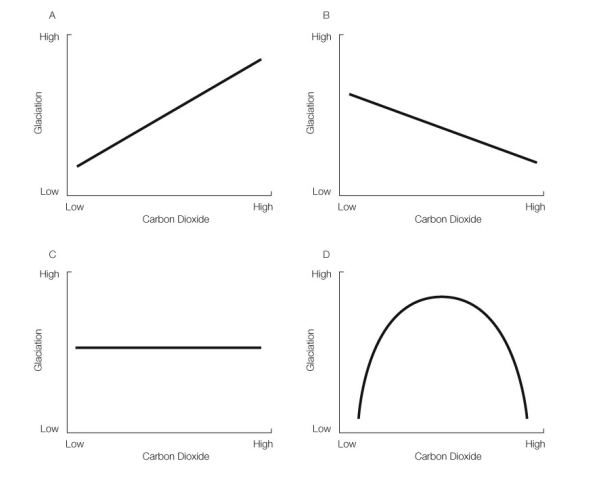
A) Graph A
B) Graph B
C) Graph C
D) Graph D
E) Insufficient information is provided to answer the question.
Correct Answer:
Verified
Q108: Which of the following statements about biogeochemical
Q109: Why do humans deliberately set fire to
Q110: In the diagram below, label the one
Q111: Which of the following is a major
Q112: Which of the following statements is true
Q114: Next to each of the following features,
Q115: Which of the following statements about acid
Q116: How does the use of groundwater for
Q117: Which of the following ecosystem types is
Q118: What is the connection between global warming
Unlock this Answer For Free Now!
View this answer and more for free by performing one of the following actions

Scan the QR code to install the App and get 2 free unlocks

Unlock quizzes for free by uploading documents