A graph of class data is below. What is this type of graph called? 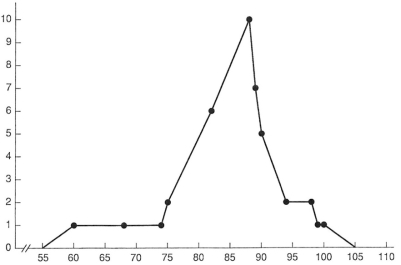
A) Frequency distribution
B) Normal distribution
C) Bell curve
D) Frequency polygon
Correct Answer:
Verified
Q14: In a normal distribution, most students' scores
Q20: The square root of the variance is
Q21: What type of distribution is depicted below?
Q23: Using the data set below,answer the
Q26: Using the bell curve below,answer the
Q28: Using the information below, answer the questions
Q28: When the mean score is represented as
Q34: What is the percentile rank that is
Q36: A person who scores at the 85%tile
Q58: How are the measures of central tendency
Unlock this Answer For Free Now!
View this answer and more for free by performing one of the following actions

Scan the QR code to install the App and get 2 free unlocks

Unlock quizzes for free by uploading documents