 Figure 1
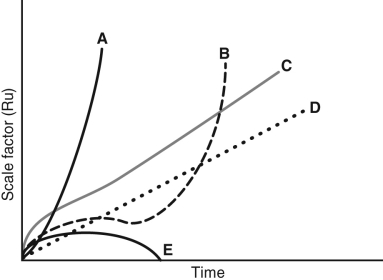
-Figure 1 shows five possible graphs of the scale factor of the universe as a function of time. Which of these graphs represent our universe where mass = 0.3 and =0.7?
A) A
B) B
C) C
D) D
E) E
Correct Answer:
Verified
Q35: What two properties of the universe
Q36: The observations that show that the expansion
Q37: How does the existence of dark energy
Q38: Current observations suggest that the density
Q39: In the 1990s, astronomers found that distant
Q41: The figure below illustrates pair production in
Q42: The universe can be infinite in size
Q43: In order to produce an electron
Q44: To verify whether or not some grand
Q45: ![]()
Unlock this Answer For Free Now!
View this answer and more for free by performing one of the following actions

Scan the QR code to install the App and get 2 free unlocks

Unlock quizzes for free by uploading documents