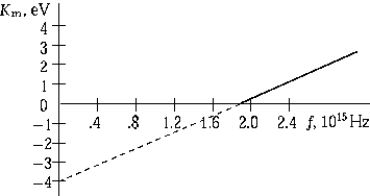
 The graph shows the maximum kinetic energy of electrons emitted by a photosensitive surface as a function of the frequency of the incident radiation. The slope of this curve represents
A) the intensity of the incident radiation.
B) the maximum kinetic energy.
C) the threshold frequency.
D) Planck's constant.
E) the stopping potential.
Correct Answer:
Verified
Q21: Calculate the photon energy for light
Q22: A Compton-scattered X-ray photon has less energy
Q25: The man whose name is most closely
Q26: The maximum kinetic energy of photoelectrons produced
Q27: In the Compton effect,
A)an electron is stopped
Q34: When a certain X ray is
Unlock this Answer For Free Now!
View this answer and more for free by performing one of the following actions

Scan the QR code to install the App and get 2 free unlocks

Unlock quizzes for free by uploading documents