Use the following to answer question: 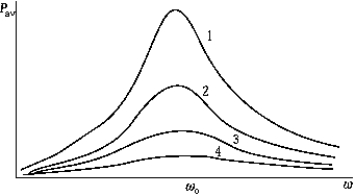
-The graph shows the average power delivered to an oscillating system as a function of the driving frequency.According to these data
A) the resonant frequency is greater than o.
B) the system corresponding to curve 1 has the largest quality factor.
C) the system corresponding to curve 4 has the largest quality factor.
D) the resonant frequency is less than o.
E) None of these is correct.
Correct Answer:
Verified
Q103: Use the following to answer question:
Q104: Which of the following statements is true
Q105: A damped oscillator has a decay
Q106: What is the amplitude after 1 s?
A)2
Q107: The energy of an oscillator decreases by
Q109: Use the following to answer question:
Q110: The energy of an oscillator decreases by
Q111: When driving over a washboard speed bumps,certain
Q112: The differential equation for a damped oscillator
Q113: Use the figure to the right to
Unlock this Answer For Free Now!
View this answer and more for free by performing one of the following actions

Scan the QR code to install the App and get 2 free unlocks

Unlock quizzes for free by uploading documents