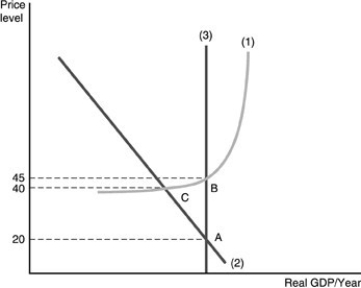
-The three curves in the above figure are
A) (1) the long-run aggregate supply curve, (2) the aggregate demand curve, and (3) the short-run aggregate supply curve.
B) (1) the long-run aggregate supply curve, (2) the short-run aggregate supply curve, and (3) the aggregate demand curve.
C) (1) the short-run aggregate supply curve, (2) the aggregate demand curve, and (3) the long-run aggregate supply curve.
D) (1) the aggregate supply curve, (2) the short-run aggregate demand curve, and (3) the long-run aggregate demand curve.
Correct Answer:
Verified
Q293: Refer to the above figure. Which point
Q294: A change in tastes for U.S. produced
Q295: In the Keynesian model, an aggregate demand
Q296: Holding the level of prices fixed implies
Q297: A short-run equilibrium occurs
A) at the intersection
Q299: Refer to the above figure. Suppose the
Q300: Assume equilibrium real GDP per year is
Q301: In the above figure, what could cause
Q302: The gap that exists when equilibrium real
Q303: A recessionary gap occurs when
A) aggregate demand
Unlock this Answer For Free Now!
View this answer and more for free by performing one of the following actions

Scan the QR code to install the App and get 2 free unlocks

Unlock quizzes for free by uploading documents