Multiple Choice
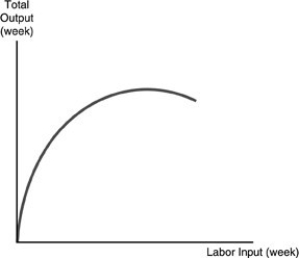
-Refer to the above figure. The curve represents a
A) marginal product curve.
B) total product curve.
C) total cost curve.
D) average total cost curve.
Correct Answer:
Verified
Related Questions
Q93: The production function does NOT provide information
Q94: If the average product of 20 workers
Q95: Total product divided by the variable input
Q96: The relationship between inputs and outputs is
Q97: As the amount of a variable input
Q99: The physical output that is due to
Q100: Marginal product and average product are measured
Unlock this Answer For Free Now!
View this answer and more for free by performing one of the following actions

Scan the QR code to install the App and get 2 free unlocks

Unlock quizzes for free by uploading documents