Multiple Choice
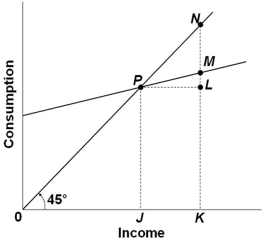 The graph above shows the relationship between consumption and income. The ratio LM/PL would be a measure of the:
A) Marginal propensity to consume
B) Marginal propensity to save
C) Average propensity to consume
D) Average propensity to save
Correct Answer:
Verified
Related Questions
Q40: In an economy, for every $10 million
Q41: When the marginal propensity to consume is
Q42: The table shows a consumption schedule.
Q43: The table shows a consumption schedule.
Q45: The table shows a consumption schedule.
Unlock this Answer For Free Now!
View this answer and more for free by performing one of the following actions

Scan the QR code to install the App and get 2 free unlocks

Unlock quizzes for free by uploading documents