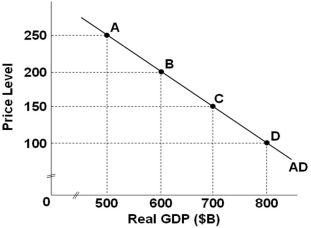
 Refer to the graph above, which shows an aggregate demand curve. If the price level decreases from 200 to 100, the real output demanded will:
A) Increase by $800 billion
B) Increase by $200 billion
C) Decrease by $600 billion
D) Decrease by $200 billion
Correct Answer:
Verified
Q4: When the price level decreases:
A) The demand
Q5: In the aggregate demand-aggregate supply model, the
Q6: An increase in personal income tax rates
Q7: The real-balances effect on aggregate demand suggests
Q8: The labels for the axes of the
Q10: A decrease in interest rates caused by
Q11: An expected increase in the prices of
Q12: An increase in personal income taxes would
Unlock this Answer For Free Now!
View this answer and more for free by performing one of the following actions

Scan the QR code to install the App and get 2 free unlocks

Unlock quizzes for free by uploading documents