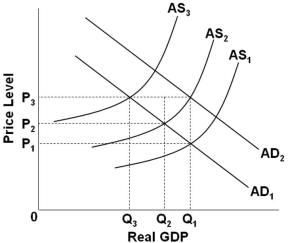
 Refer to the graph above. Suppose that the economy is at an initial equilibrium where the AD1 and AS1 curves intersect. Demand-pull inflation in the long run can best be illustrated as a shift of:
A) AS1 to AS2, and back again to AS1
B) AD1 to AD2, and back again to AD1
C) AS1 to AS2, consequently making AD1 shift to AD2
D) AD1 to AD2, consequently making AS1 shift to AS2
Correct Answer:
Verified
Q20: Equilibrium in the long run occurs when:
A)
Q21: Q22: In the cost-push model of inflation, increases Q23: The traditional Phillips Curve showing a tradeoff Q24: In the short-run, demand-pull inflation increases: Q26: What will occur in the short run Q27: If cost-push inflation occurs and the government Q28: If the government uses expansionary monetary or Q29: Q30: Unlock this Answer For Free Now! View this answer and more for free by performing one of the following actions Scan the QR code to install the App and get 2 free unlocks Unlock quizzes for free by uploading documents![]()
A) Real![]()
![]()

