In the graphs below, QP refers to the economy's potential output level. 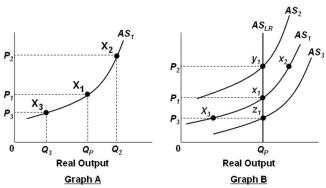 Refer to the graphs above. In Graph A, a decrease in the price level from P1 to P3 will lead to:
A) A decrease in profits, an increase in real output, and a decrease in the unemployment rate
B) A decrease in profits, a decrease in real output, and a decrease in the unemployment rate
C) A decrease in profits, a decrease in real output, and an increase in the unemployment rate
D) An increase in profits, an increase in real output, and a decrease in the unemployment rate
Correct Answer:
Verified
Q1: In the graphs below, QP refers to
Q2: In the short run, if the price
Q3: In the short run, the price level
Q4: In the graphs below, QP refers to
Q6: In the short run, nominal wages and
Q7: Assume that initially your nominal wage was
Q8: In the long run, if the price
Q9: In the graphs below, QP refers to
Q10: In the graphs below, QP refers to
Q11: The short-run aggregate supply curve illustrates the
Unlock this Answer For Free Now!
View this answer and more for free by performing one of the following actions

Scan the QR code to install the App and get 2 free unlocks

Unlock quizzes for free by uploading documents