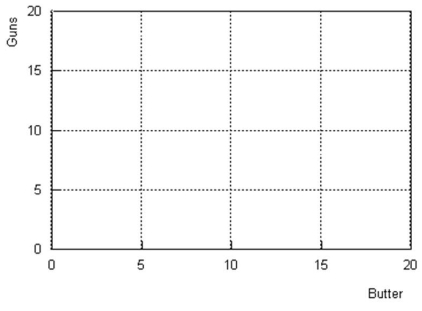
The table below is a production possibility table for the fictional country of Myopia.Use it to construct the corresponding production possibility curve in the quadrant below.(Label the axes.)

(a)Explain the meaning of a production possibilities curve.
(b)What is assumed to be constant when we draw that curve?
(c)How is a point on the curve different from (1)a point below the curve or (2)a point above the curve?
(d)How does this curve illustrate the concept of opportunity cost?
(e)How does it illustrate the principle of increasing marginal opportunity cost?
Correct Answer:
Verified
View Answer
Unlock this answer now
Get Access to more Verified Answers free of charge
Q1: Consider a farmer's production possibilities curve, with
Q2: What is the principle of increasing marginal
Q6: What is a production possibilities curve?
Q9: Below is the production possibilities table
Q12: Can a country gain comparative advantage in
Q13: What does it mean when we say
Q14: In what way does the notion of
Q15: Most advanced nations have both agricultural sectors
Q16: Draw a production possibilities curve that indicates
Q18: Does the production possibilities curve tell us
Unlock this Answer For Free Now!
View this answer and more for free by performing one of the following actions

Scan the QR code to install the App and get 2 free unlocks

Unlock quizzes for free by uploading documents