Consider the following diagram
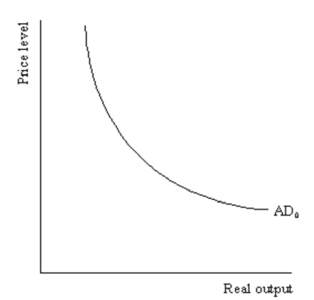 Demonstrate graphically and explain verbally the impact of a decrease of 50 in government spending on the AD curve in the diagram when the multiplier is 3.
Correct Answer:
Verified
View Answer
Unlock this answer now
Get Access to more Verified Answers free of charge
Q201: Demonstrate graphically and explain verbally the role
Q205: Why is the short-run aggregate supply (SAS)curve
Q208: What are the three ways that falling
Q211: Assuming the economy is in long-run equilibrium,using
Q213: What are feedback effects,and how does the
Q214: What factors shift the short-run aggregate supply
Q216: Explain verbally and demonstrate graphically how in
Q217: How might feedback effects cause a fall
Q218: Demonstrate graphically and explain verbally a recessionary
Q219: Using an AS/AD diagram,demonstrate graphically and explain
Unlock this Answer For Free Now!
View this answer and more for free by performing one of the following actions

Scan the QR code to install the App and get 2 free unlocks

Unlock quizzes for free by uploading documents