Consider Figure 14.6 below. Discuss the relationship between these two series, with particular attention to the Fisher equation.
Figure 14.6: U.S. 10-Year Bond Yield and Inflation 2006-2010 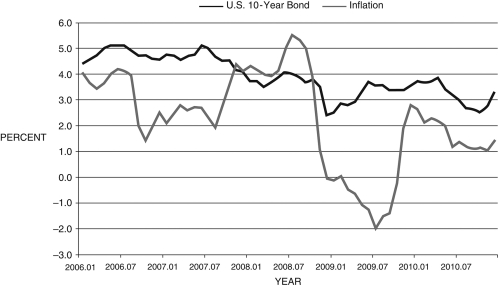
(Source: Federal Reserve Economic Data, St. Louis Federal Reserve)
Correct Answer:
Verified
View Answer
Unlock this answer now
Get Access to more Verified Answers free of charge
Q84: The price-to-earnings ratio is useful in identifying
Q92: Economists believe that bailing out banks in
Q96: The financial friction raises the borrowing rate
Q97: The event that likely caused the financial
Q98: In dollars, the magnitude of the Fed's
Q99: If the rate of inflation is -2
Q100: The burst of the housing bubble
Q102: Between January 1985 and January 1990, the
Q104: Briefly discuss the Fed's balance sheet before
Q106: You are a newly hired reporter for
Unlock this Answer For Free Now!
View this answer and more for free by performing one of the following actions

Scan the QR code to install the App and get 2 free unlocks

Unlock quizzes for free by uploading documents