Refer to the following figure when answering
Figure 5.3: Solow Diagram 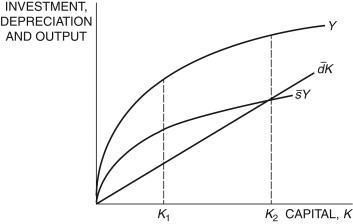
-In Figure 5.3, at K1, the difference between and
Is ________ and the difference between Y and
Is ________.
A) output; investment
B) net investment; consumption
C) gross investment; consumption
D) output; consumption
E) depreciation; gross investment
Correct Answer:
Verified
Q23: The endogenous variables in the Solow model
Q40: In the Solow model, net investment is
Q41: An increase in _ leads to a
Q42: If a natural disaster destroys a large
Q45: An increase in _ leads to a
Q46: In the Solow model, if capital is
Q46: The steady-state level of output per
Q47: Assume a production function is given
Q48: In the Solow model, the steady-state capital
Q49: In the standard production model, the productivity
Unlock this Answer For Free Now!
View this answer and more for free by performing one of the following actions

Scan the QR code to install the App and get 2 free unlocks

Unlock quizzes for free by uploading documents