Refer to the following figure when answering
Figure 5.2 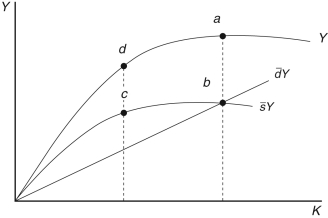
-In Figure 5.2, steady state consumption is represented by:
A) a b
B) c a
C) Consumption is not represented.
D) b
E) a d
Correct Answer:
Verified
Q53: In the Solow model, if, in the
Q54: An increase in _ leads to a
Q55: In the Solow model, the steady-state level
Q56: In the Solow model, it is assumed
Q57: In the Solow model, the _ plays
Q59: If the production function is given
Q60: Assume a production function is given
Q61: Immediately following the increase in the saving
Q71: In the Solow model, if a country's
Q80: Suppose you are given the data for
Unlock this Answer For Free Now!
View this answer and more for free by performing one of the following actions

Scan the QR code to install the App and get 2 free unlocks

Unlock quizzes for free by uploading documents