Exhibit 10-10 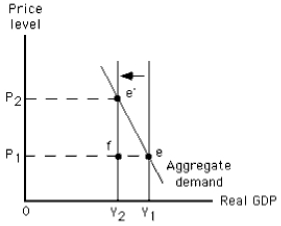
-The graph in Exhibit 10-10 shows a(n)
A) increase in long-run aggregate supply
B) increase in short-run aggregate supply
C) decrease in short-run aggregate supply
D) decrease in long-run aggregate supply
E) increase in aggregate quantity demanded
Correct Answer:
Verified
Q185: If global pollution causes climatic changes that
Q186: As macroeconomic output expands,the cost of additional
Q187: An adverse supply shock would shift the
A)short-run
Q188: Because nominal wages fall slowly,the supply-side adjustments
Q189: Given the aggregate demand curve,an adverse supply
Q191: Which of the following occurs as macroeconomic
Q192: The key resource underlying aggregate supply is
A)economic
Q193: Suppose the economy is initially in long-run
Q194: Firms _ output as long as the
Q195: Which of the following changes best represents
Unlock this Answer For Free Now!
View this answer and more for free by performing one of the following actions

Scan the QR code to install the App and get 2 free unlocks

Unlock quizzes for free by uploading documents