The graph shows the numbers of performers who were elected to the Rock and Roll Hall of Fame from 1991 through 2008.Describe any trends in the data.From these trends,predict the number of performers elected in 2009. 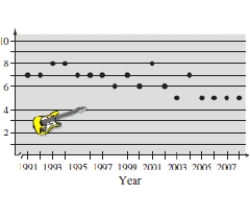
A) The number of performers elected in last four years in the graph seems to be nearly steady except for the first few years therefore five performers will be elected in 2009.
B) The number of performers elected in last four years in the graph seems to be nearly steady except for the first few years therefore seven performers will be elected in 2009.
C) The number of performers elected in last four years in the graph seems to be nearly steady except for the first few years therefore eight performers will be elected in 2009.
D) The number of performers elected in last four years in the graph seems to be nearly steady except for the first few years therefore six performers will be elected in 2009.
E) The number of performers elected in last four years in the graph seems to be nearly steady except for the first few years therefore nine performers will be elected in 2009.
Correct Answer:
Verified
Q43: Use the graph,which shows the average retail
Q44: The Coca-Cola Company had sales of $19,999
Q45: Find the coordinates of the point that
Q46: A soccer player passes the ball
Q47: Find the coordinates of the vertices of
Q49: Determine the quadrant(s)in which (x,y)is located so
Q50: Find the coordinates of the vertices of
Q51: Use the graph,which shows the average retail
Q52: Find the midpoint of the line segment
Q53: A quarterback is standing in the middle
Unlock this Answer For Free Now!
View this answer and more for free by performing one of the following actions

Scan the QR code to install the App and get 2 free unlocks

Unlock quizzes for free by uploading documents