Multiple Choice
The amounts A (in billions of dollars) donated to support higher education in the United States from 2000 through 2007 are shown in the table,where t represents the year,with t = 0 corresponding to 2000.
Use a graphing utility to select a correct a scatter plot of the above data.
A) 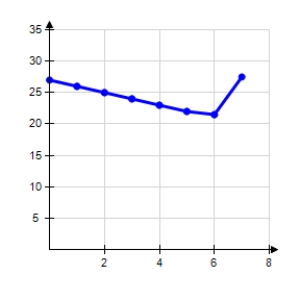
B) 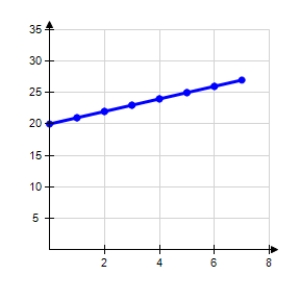
C) 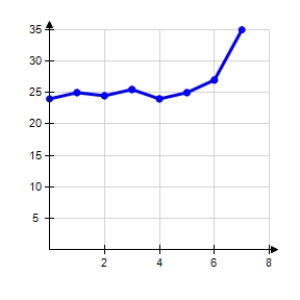
D) 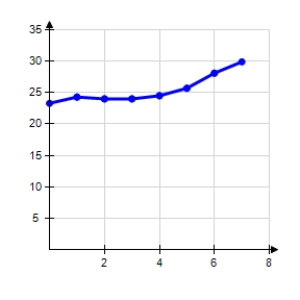
E) 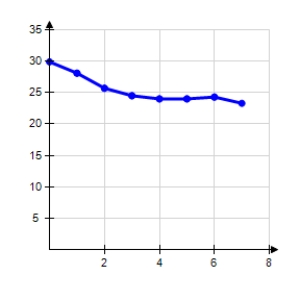
Correct Answer:
Verified
Related Questions
Q1: Use synthetic division to divide.
Q2: Use long division to divide.
Q3: Use long division to divide.
Q5: Use synthetic division to divide.
Unlock this Answer For Free Now!
View this answer and more for free by performing one of the following actions

Scan the QR code to install the App and get 2 free unlocks

Unlock quizzes for free by uploading documents