Multiple Choice
A biology class performs an experiment comparing the quantity of food consumed by a certain kind of moth with the quantity supplied.The model for the experimental data is given by
Where x is the quantity (in milligrams) of food supplied and y is the quantity (in milligrams) of food consumed.
Select the correct graph of this model.
A) 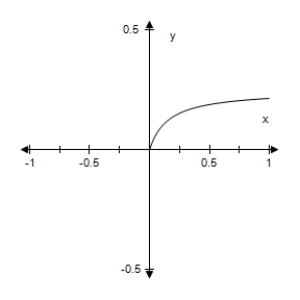
B) 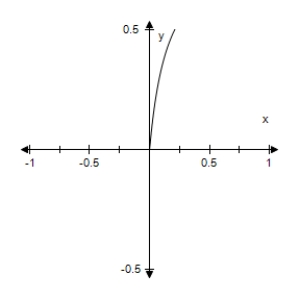
C) 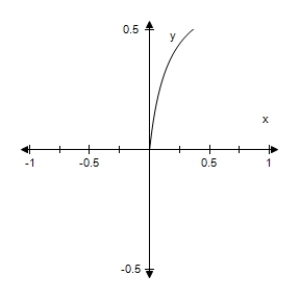
D) 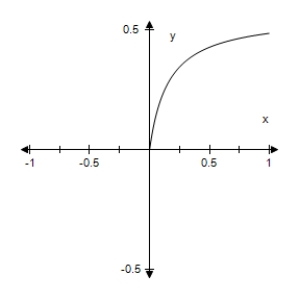
E) 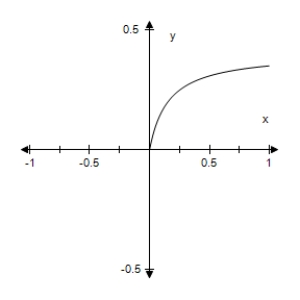
Correct Answer:
Verified
Related Questions
Q76: The cost C (in millions of

