The numbers N (in millions) of students enrolled in schools in the United States from 1995 through 1997 are shown in the table.
Use a graphing utility to create a scatter plot of the data.Let t represent the year,with t = 5 corresponding to 1995.
A) 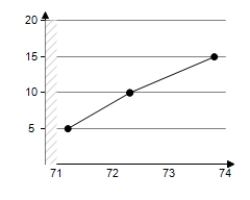
B) 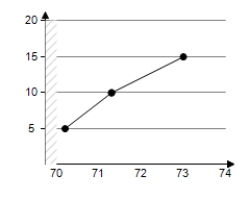
C) 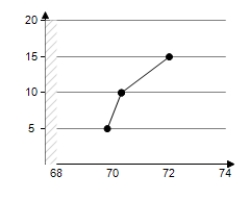
D) 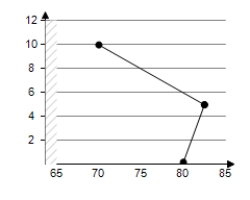
E) 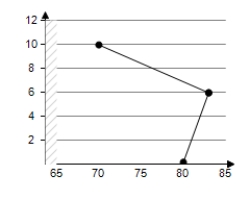
Correct Answer:
Verified
Q36: Find the domain of x in
Q37: Find the domain of x in
Q38: Solve the inequality and graph the
Q39: Use a graphing utility to graph
Q40: Find the domain of x in
Q42: Determine the intervals on which the
Q43: Find the domain of x in
Q44: Find the domain of x in
Q45: Determine whether the statement is true
Q46: Use the position equation
Unlock this Answer For Free Now!
View this answer and more for free by performing one of the following actions

Scan the QR code to install the App and get 2 free unlocks

Unlock quizzes for free by uploading documents