The projected monthly sales (in thousands of units) of lawn mowers (a seasonal product) are modeled by where t is the time (in months) ,with t = 1 corresponding to January.Select the graph of the sales function over 1 year.
A) 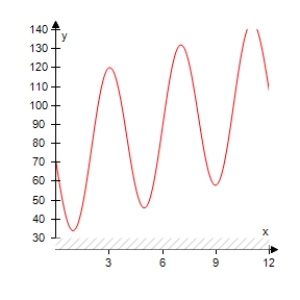
B) 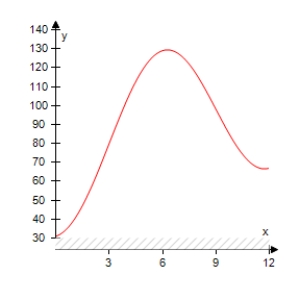
C) 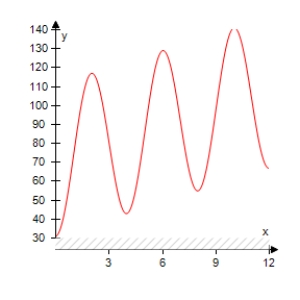
D) 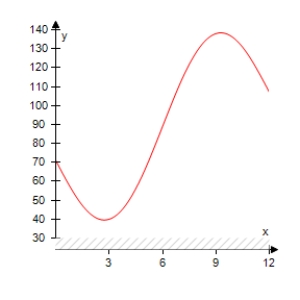
E) 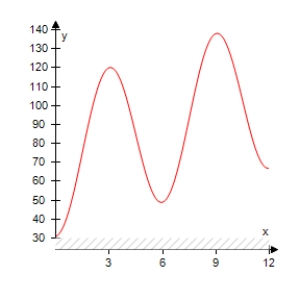
Correct Answer:
Verified
Q20: Select the graph of the function
Q21: Use a graphing utility to select
Q22: Describe the behavior of the function
Q23: Describe the behavior of the function
Q24: Use a graphing utility to select
Q26: Describe the behavior of the function
Q27: Use a graphing utility to select
Q28: Determine whether the function below is
Q29: Describe the behavior of the function
Q30: Determine whether the function below is
Unlock this Answer For Free Now!
View this answer and more for free by performing one of the following actions

Scan the QR code to install the App and get 2 free unlocks

Unlock quizzes for free by uploading documents