Use a graphing utility to graph the inequalities.Shade the region representing the solution set of the system.
A) 10 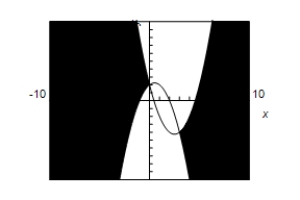 -10
-10
B) 10 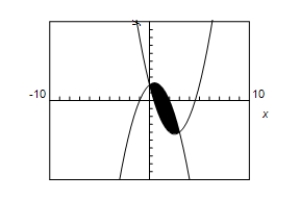 -10
-10
C) 10 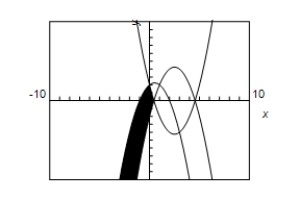 -10
-10
D) 10 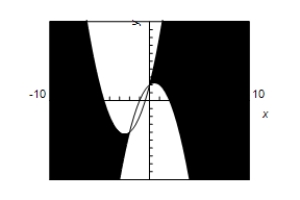 -10
-10
E) 10 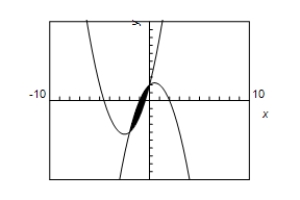 -10
-10
Correct Answer:
Verified
Q36: Find the consumer surplus and producer
Q37: Select a set of inequalities to
Q38: A dietitian is asked to design
Q39: Select an inequality for the shaded
Q40: Find the consumer surplus and producer
Q42: Sketch the graph and label the
Q43: Determine which one of the ordered
Q44: For the given supply and demand
Q45: Write an inequality for the shaded
Q46: Use a graphing utility to graph
Unlock this Answer For Free Now!
View this answer and more for free by performing one of the following actions

Scan the QR code to install the App and get 2 free unlocks

Unlock quizzes for free by uploading documents