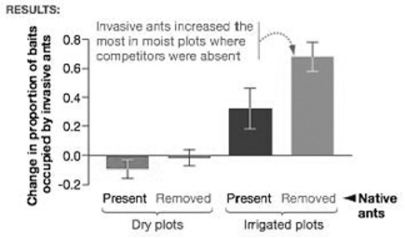
 The accompanying graph shows data from a research study designed to test the hypothesis that both abiotic and biotic factors can affect the distribution of invasive Argentine ants. Using the graph, identify the statement that is best supported by the data.
A) Abiotic factors (e.g., soil moisture) only affect the distribution of invasive Argentine ants.
B) Biotic factors (e.g., competition) only affect the distribution of invasive Argentine ants.
C) Both abiotic and biotic factors interact to affect the distribution of invasive Argentine ants.
D) Neither abiotic nor biotic factors affect the distribution of invasive Argentine ants.
Correct Answer:
Verified
Q1: What would happen to the seasons if
Q3: If the Earth were to reorient such
Q4: Which abiotic factor would have the most
Q6: As climate changes because of global warming,
Q7: Q8: A certain species of pine tree survives Q9: How does solar radiation (per unit area) Q10: The main reason polar regions are cooler![]()
Unlock this Answer For Free Now!
View this answer and more for free by performing one of the following actions

Scan the QR code to install the App and get 2 free unlocks

Unlock quizzes for free by uploading documents