The following figure shows the growth of a population as a function of time. 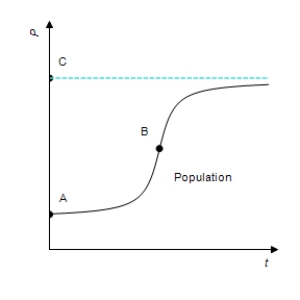 Which of A, B, and C correspond(s) to the point(s) at which the growth rate attains its maximum?
A) B
B) A
C) C
D) A and C
E) none of the above
Correct Answer:
Verified
Q58: A function and its graph are given.
Q59: Suppose the average costs of a mining
Q60: A function and its graph are given.
Q61: A function and its graph are given.
Q62: Find all points of inflection of the
Q64: Use the graph shown in the figure
Q65: Use the graph shown in the figure
Q66: A function and its graph are given.
Q67: Use the graph shown in the figure
Q68: The following figure shows the growth of
Unlock this Answer For Free Now!
View this answer and more for free by performing one of the following actions

Scan the QR code to install the App and get 2 free unlocks

Unlock quizzes for free by uploading documents