Suppose that the data in the table below shows the average earnings of year-round full-time workers by gender for several different levels of educational attainment. Find and interpret the slope of the linear regression line. Round the slope to three decimal places. 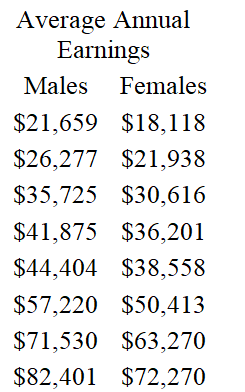
A) The slope is 0.910. The average annual earnings of females is decreasing at a rate of $0.910 per dollar increase in the annual of males.
B) The slope is 0.807. The average annual earnings of females is decreasing at a rate of $0.807 per dollar decrease in the average annual earnings of males.
C) The slope is 0.759. The average annual earnings of females is decreasing at a rate of $0.759 per dollar decrease in the average annual earnings of males.
D) The slope is 0.900. The average annual earnings of females is increasing at a rate of $0.900 per dollar increase in the average annual earnings of males.
E) The slope is 0.749. The average annual earnings of females is increasing at a rate of $0.749 per dollar increase in the average annual earnings of males.
Correct Answer:
Verified
Q93: A company manufactures two products, A and
Q94: Test for relative maximum and minimum.
Q95: Suppose that a manufacturer produces two brands
Q96: Test for relative maximum and minimum.
Q97: Test for relative maximum and minimum.

Unlock this Answer For Free Now!
View this answer and more for free by performing one of the following actions

Scan the QR code to install the App and get 2 free unlocks

Unlock quizzes for free by uploading documents