With U.S. Census Bureau data, the model that relates the per capita annual income (in thousands of dollars) of blacks B and whites W was found to be 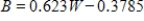 . Use a graphing utility to graph this equation for the range W-min = 0, W-max = 30; B-min = 0, B-max = 30. Is the image below the correct graph of the function?
Correct Answer:
Verified
Q156: Use a graphing utility with the specified
Q157: Graph the equation with a graphing utility;
Q158: Graph the equation with a graphing utility
Q159: Use a graphing utility with the specified
Q160: Complete the problem by using your calculator.
Q162: Solve the system of equations by using
Q163: Use the x-intercept method to find the
Q164: Use the x-intercept method to find the
Q165: Solve the system of equations by substitution.
Q166: The height above ground, S (in feet),
Unlock this Answer For Free Now!
View this answer and more for free by performing one of the following actions

Scan the QR code to install the App and get 2 free unlocks

Unlock quizzes for free by uploading documents