Suppose the IQ scores (rounded to the nearest 10) for a group of people are summarized in the table below. Find the quadratic function that best fits the data, using x as the IQ score and y as the number of people in the group with that IQ score. Use a graphing utility to estimate the IQ score of the maximum number of individuals according to the model. Round your final answer to 2 decimal places. 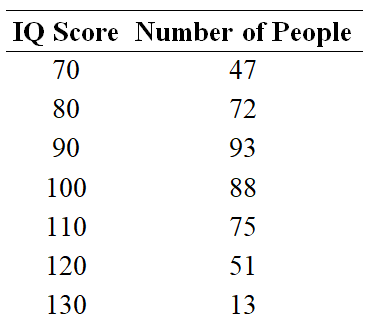
A)  The model predicts that the maximum number of people have an IQ score of approximately 96.
B)  The model predicts that the maximum number of people have an IQ score of approximately 90.
C)  The model predicts that the maximum number of people have an IQ score of approximately 90.
D)  The model predicts that the maximum number of people have an IQ score of approximately 96.
E)  The model predicts that the maximum number of people have an IQ score of approximately 90.
Correct Answer:
Verified
Q97: By recognizing shapes and features of polynomial
Q98: Sketch the graph of the function
Q99: If Q100: By recognizing shapes and features of rational Q101: The table gives the median household income Q103: Find the equation of the linear function Q104: Determine what type of function best models Q105: Suppose that the following table shows the Q106: Graph the power function that models the Q107: Suppose that the following table gives the![]()
Unlock this Answer For Free Now!
View this answer and more for free by performing one of the following actions

Scan the QR code to install the App and get 2 free unlocks

Unlock quizzes for free by uploading documents