The graph of the profit function 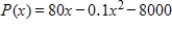 is given as follows. Consider the average rate of change of the profit from a to 400 where a lies to the left of 400. Does the average rate of change of the profit get closer to 0 or farther from 0 as a gets closer to 400?
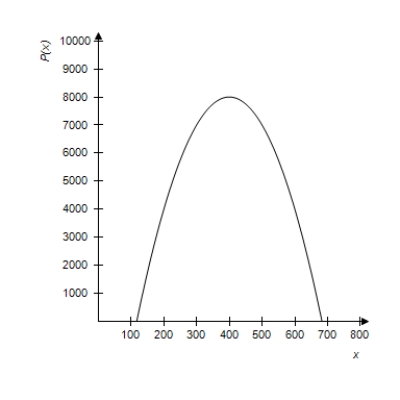
A) closer to 0
B) farther from 0
Correct Answer:
Verified
Q60: The daily profit from the sale of
Q61: Suppose a company has fixed costs of
Q62: Sketch the graph of the function
Q63: Assume that sales revenues, in millions, for
Q64: Form the profit function for the cost
Q66: If, in a monopoly market, the demand
Q67: Sketch the graph of the function
Q68: Given the profit function, Q69: Find the maximum revenue for the revenue Q70: Use a graphing calculator to graph the![]()
Unlock this Answer For Free Now!
View this answer and more for free by performing one of the following actions

Scan the QR code to install the App and get 2 free unlocks

Unlock quizzes for free by uploading documents