Because the derivative of a function represents both the slope of the tangent to the curve and the instantaneous rate of change of the function, it is possible to use information about one to gain information about the other. In this problem, use the graph of the function  given in the figure.
 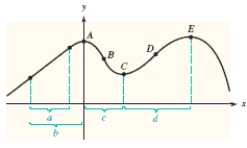 Over what interval(s) (a) through (d) is the rate of change of f (x) positive?
A) b c d
B) c
C) a b c d
D) a b c
E) a b d
Correct Answer:
Verified
Q81: Use the given table to approximate
Q82: Because the derivative of a function represents
Q83: Given the graph of Q84: Suppose the graph shows a manufacturer's total Q85: Because the derivative of a function represents Q87: In the figure given in this problem,![]()
Unlock this Answer For Free Now!
View this answer and more for free by performing one of the following actions

Scan the QR code to install the App and get 2 free unlocks

Unlock quizzes for free by uploading documents